PolypPal is a precision measurement tool for tracking size changes in biological specimens across two timepoints. Point-and-click simplicity, automatic image registration, and direct Excel export — built for fieldwork, refined for science.
In the field & lab
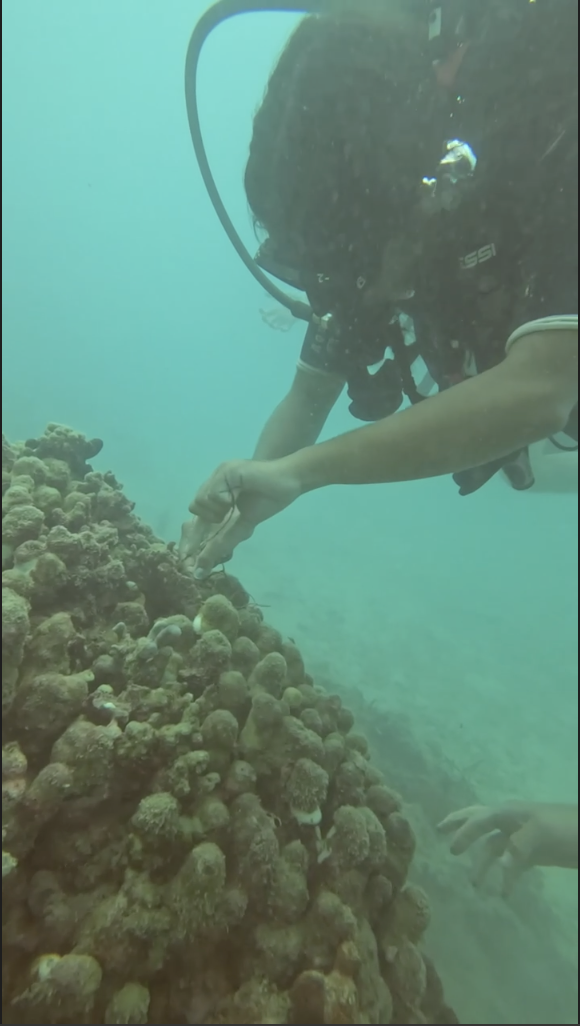
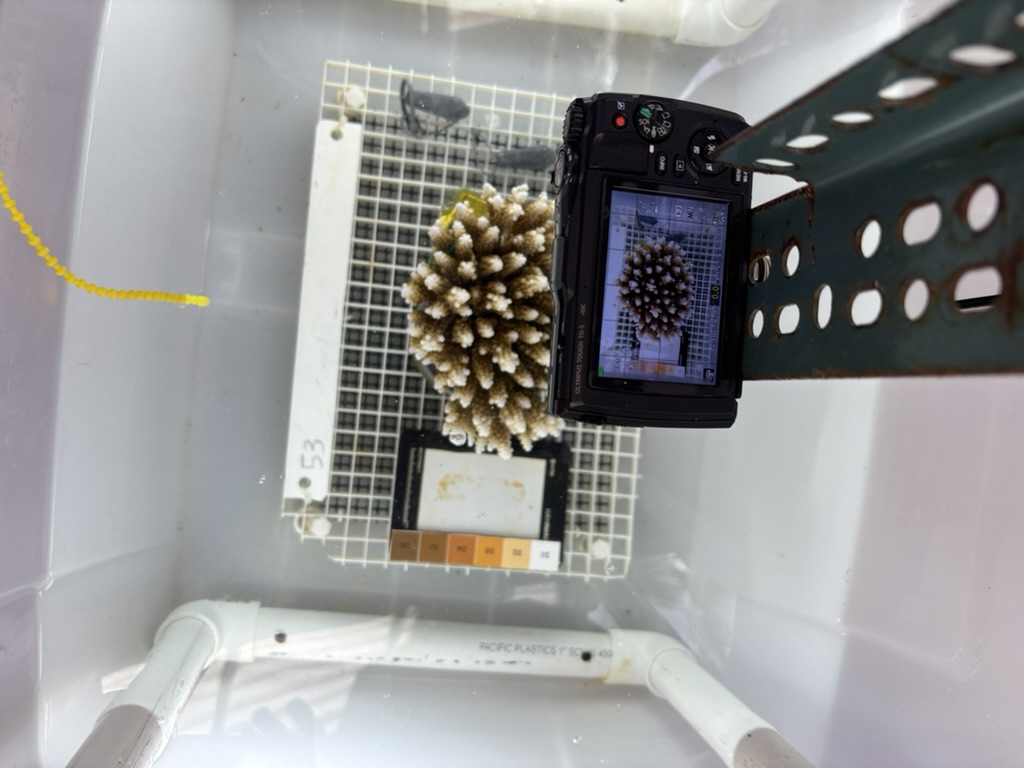
Originally developed for coral recruitment studies in Palau, PolypPal was designed around the realities of fieldwork — underwater collection, lab photography with a ruler, and rapid measurement sessions with large sample sets.
The tool has since been validated against ImageJ on 23 recruits across 10 settlement plugs, achieving Pearson r > 0.994 at both timepoints.
Read Example Study ↗
Core capabilities
Everything needed for two-timepoint size tracking, from a single unified interface.
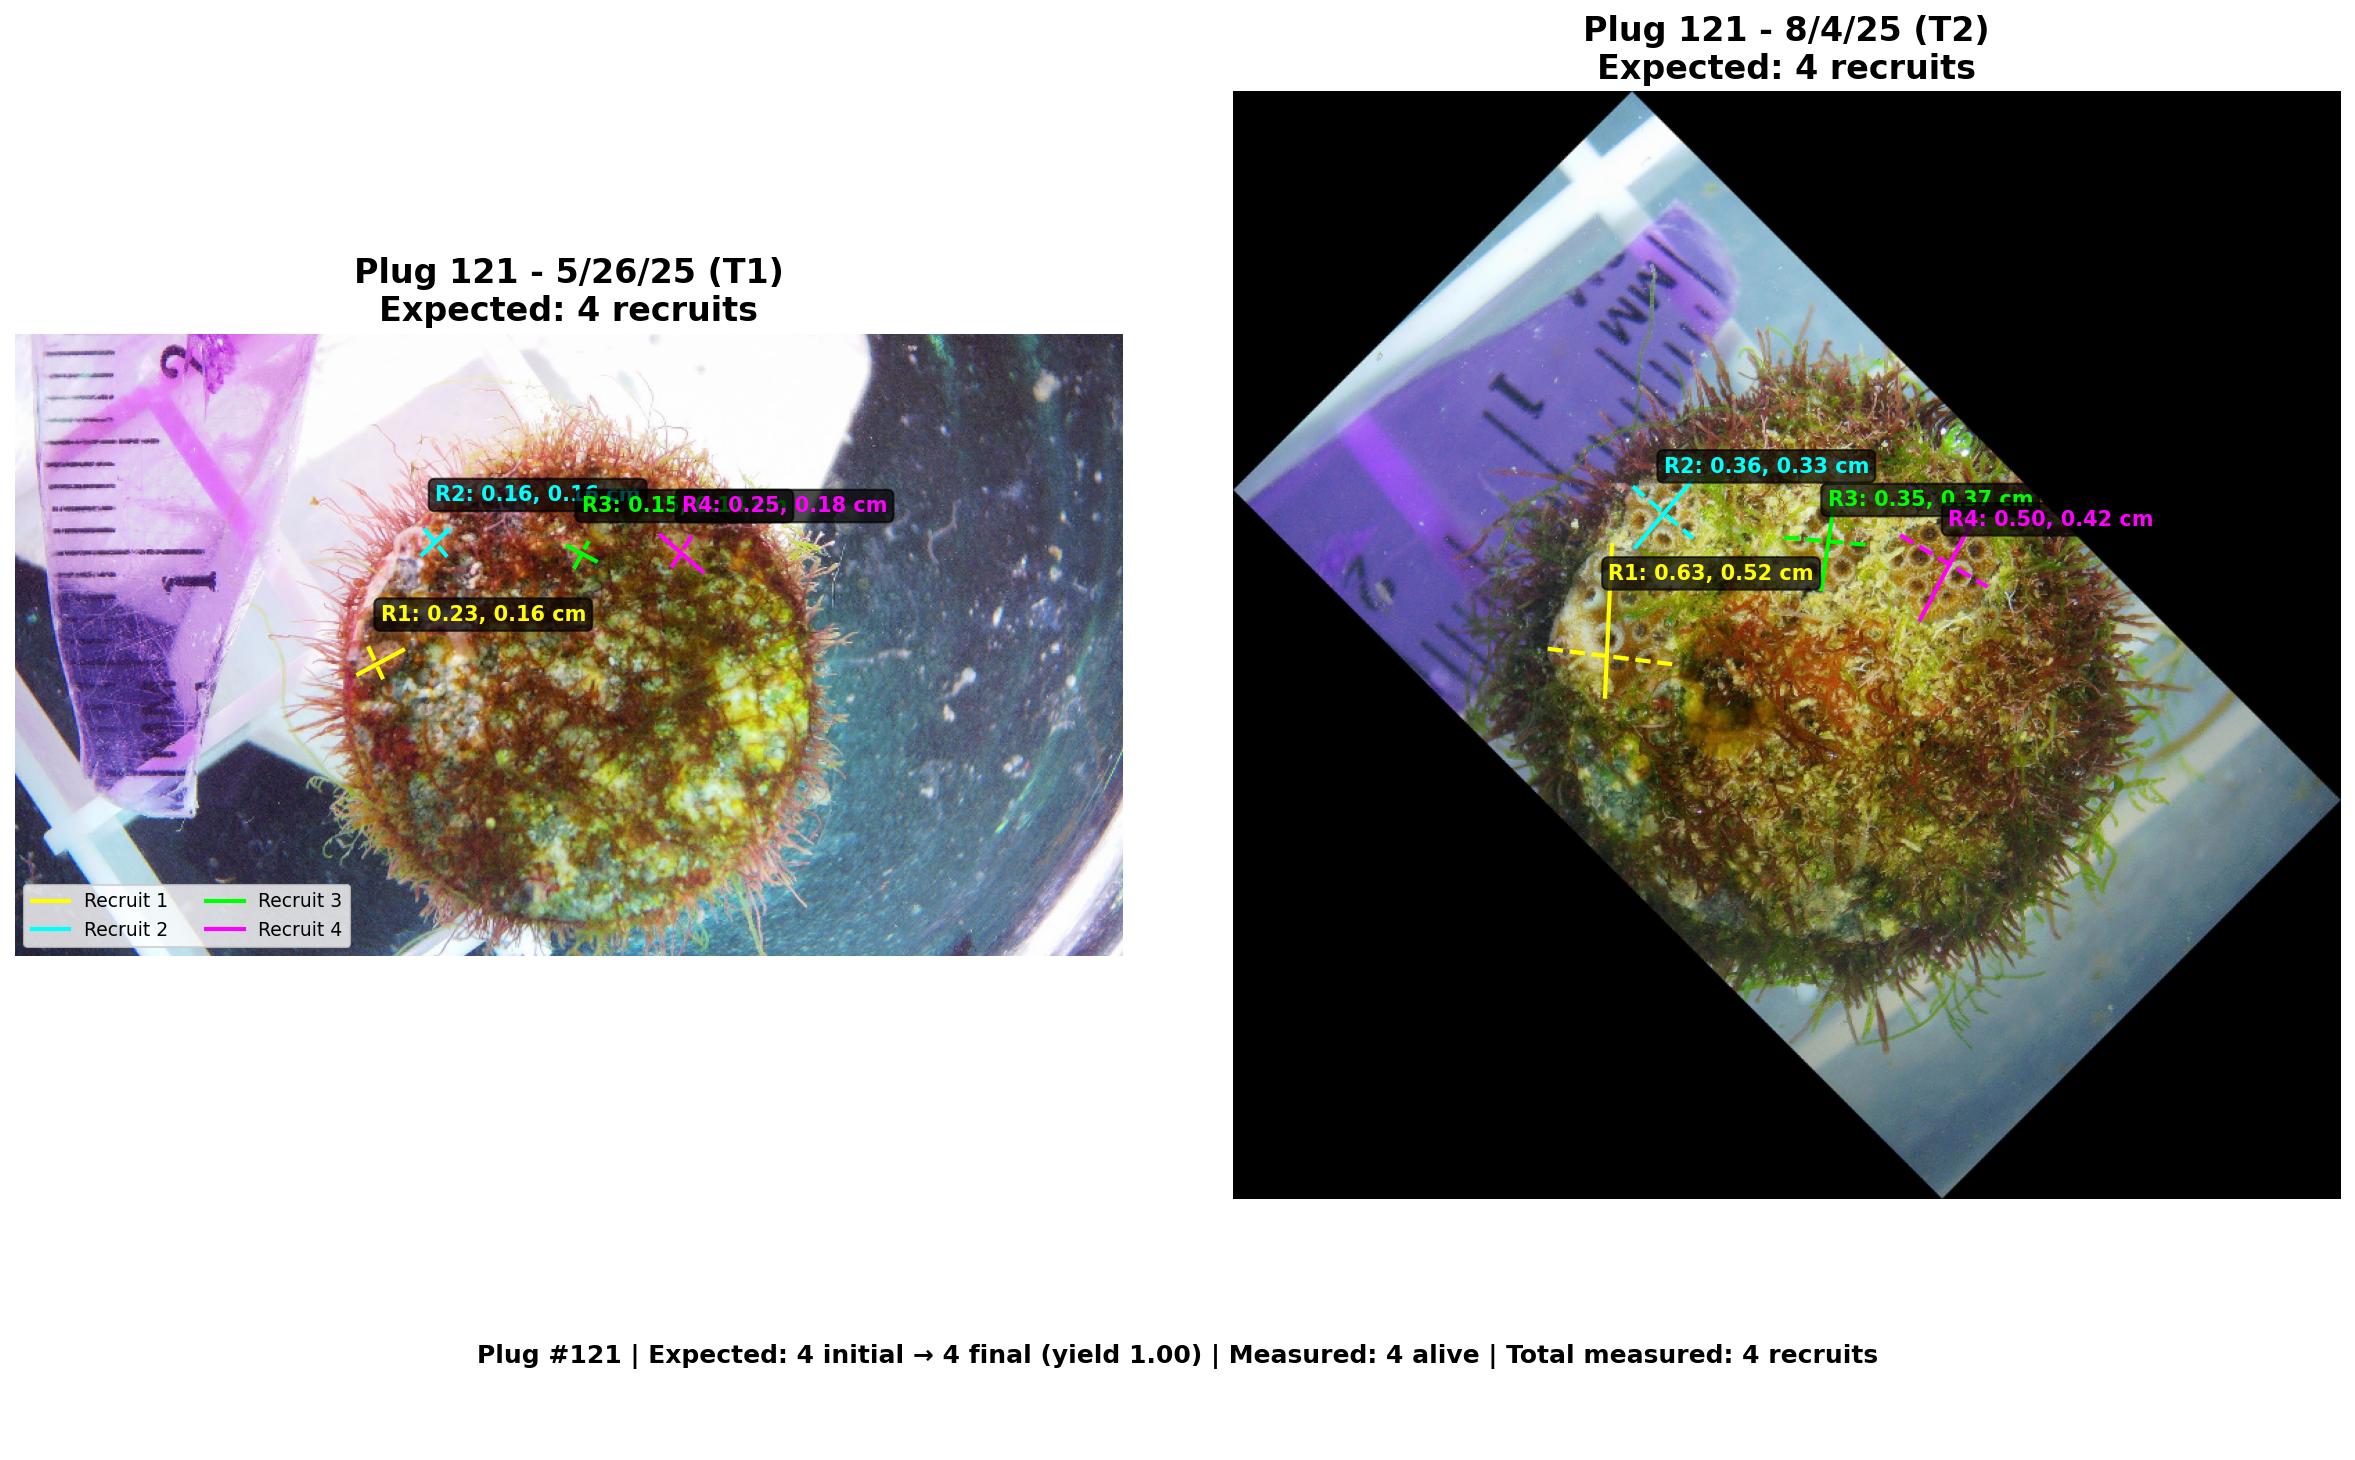
Click two points for each diameter — no image processing expertise required. Measurements appear in real-time as you work.
Detects and aligns objects across timepoints automatically. Manual rotation (q/e keys) fine-tunes alignment — coordinates transform accordingly.
All diameters, calculated areas, status flags, and timestamps export directly to .xlsx. Annotated PNG images saved alongside.
JSON-based state means you can close the window and pick up exactly where you left off. Progress shown in metadata-driven mode.
Compared against ImageJ on 23 recruits across 10 plugs. Pearson r > 0.994 at T1 and T2. Mean absolute error < 0.007 cm.
YAML config file controls image paths, output locations, and button labels — adapt status buttons for any application without editing code.
Output examples
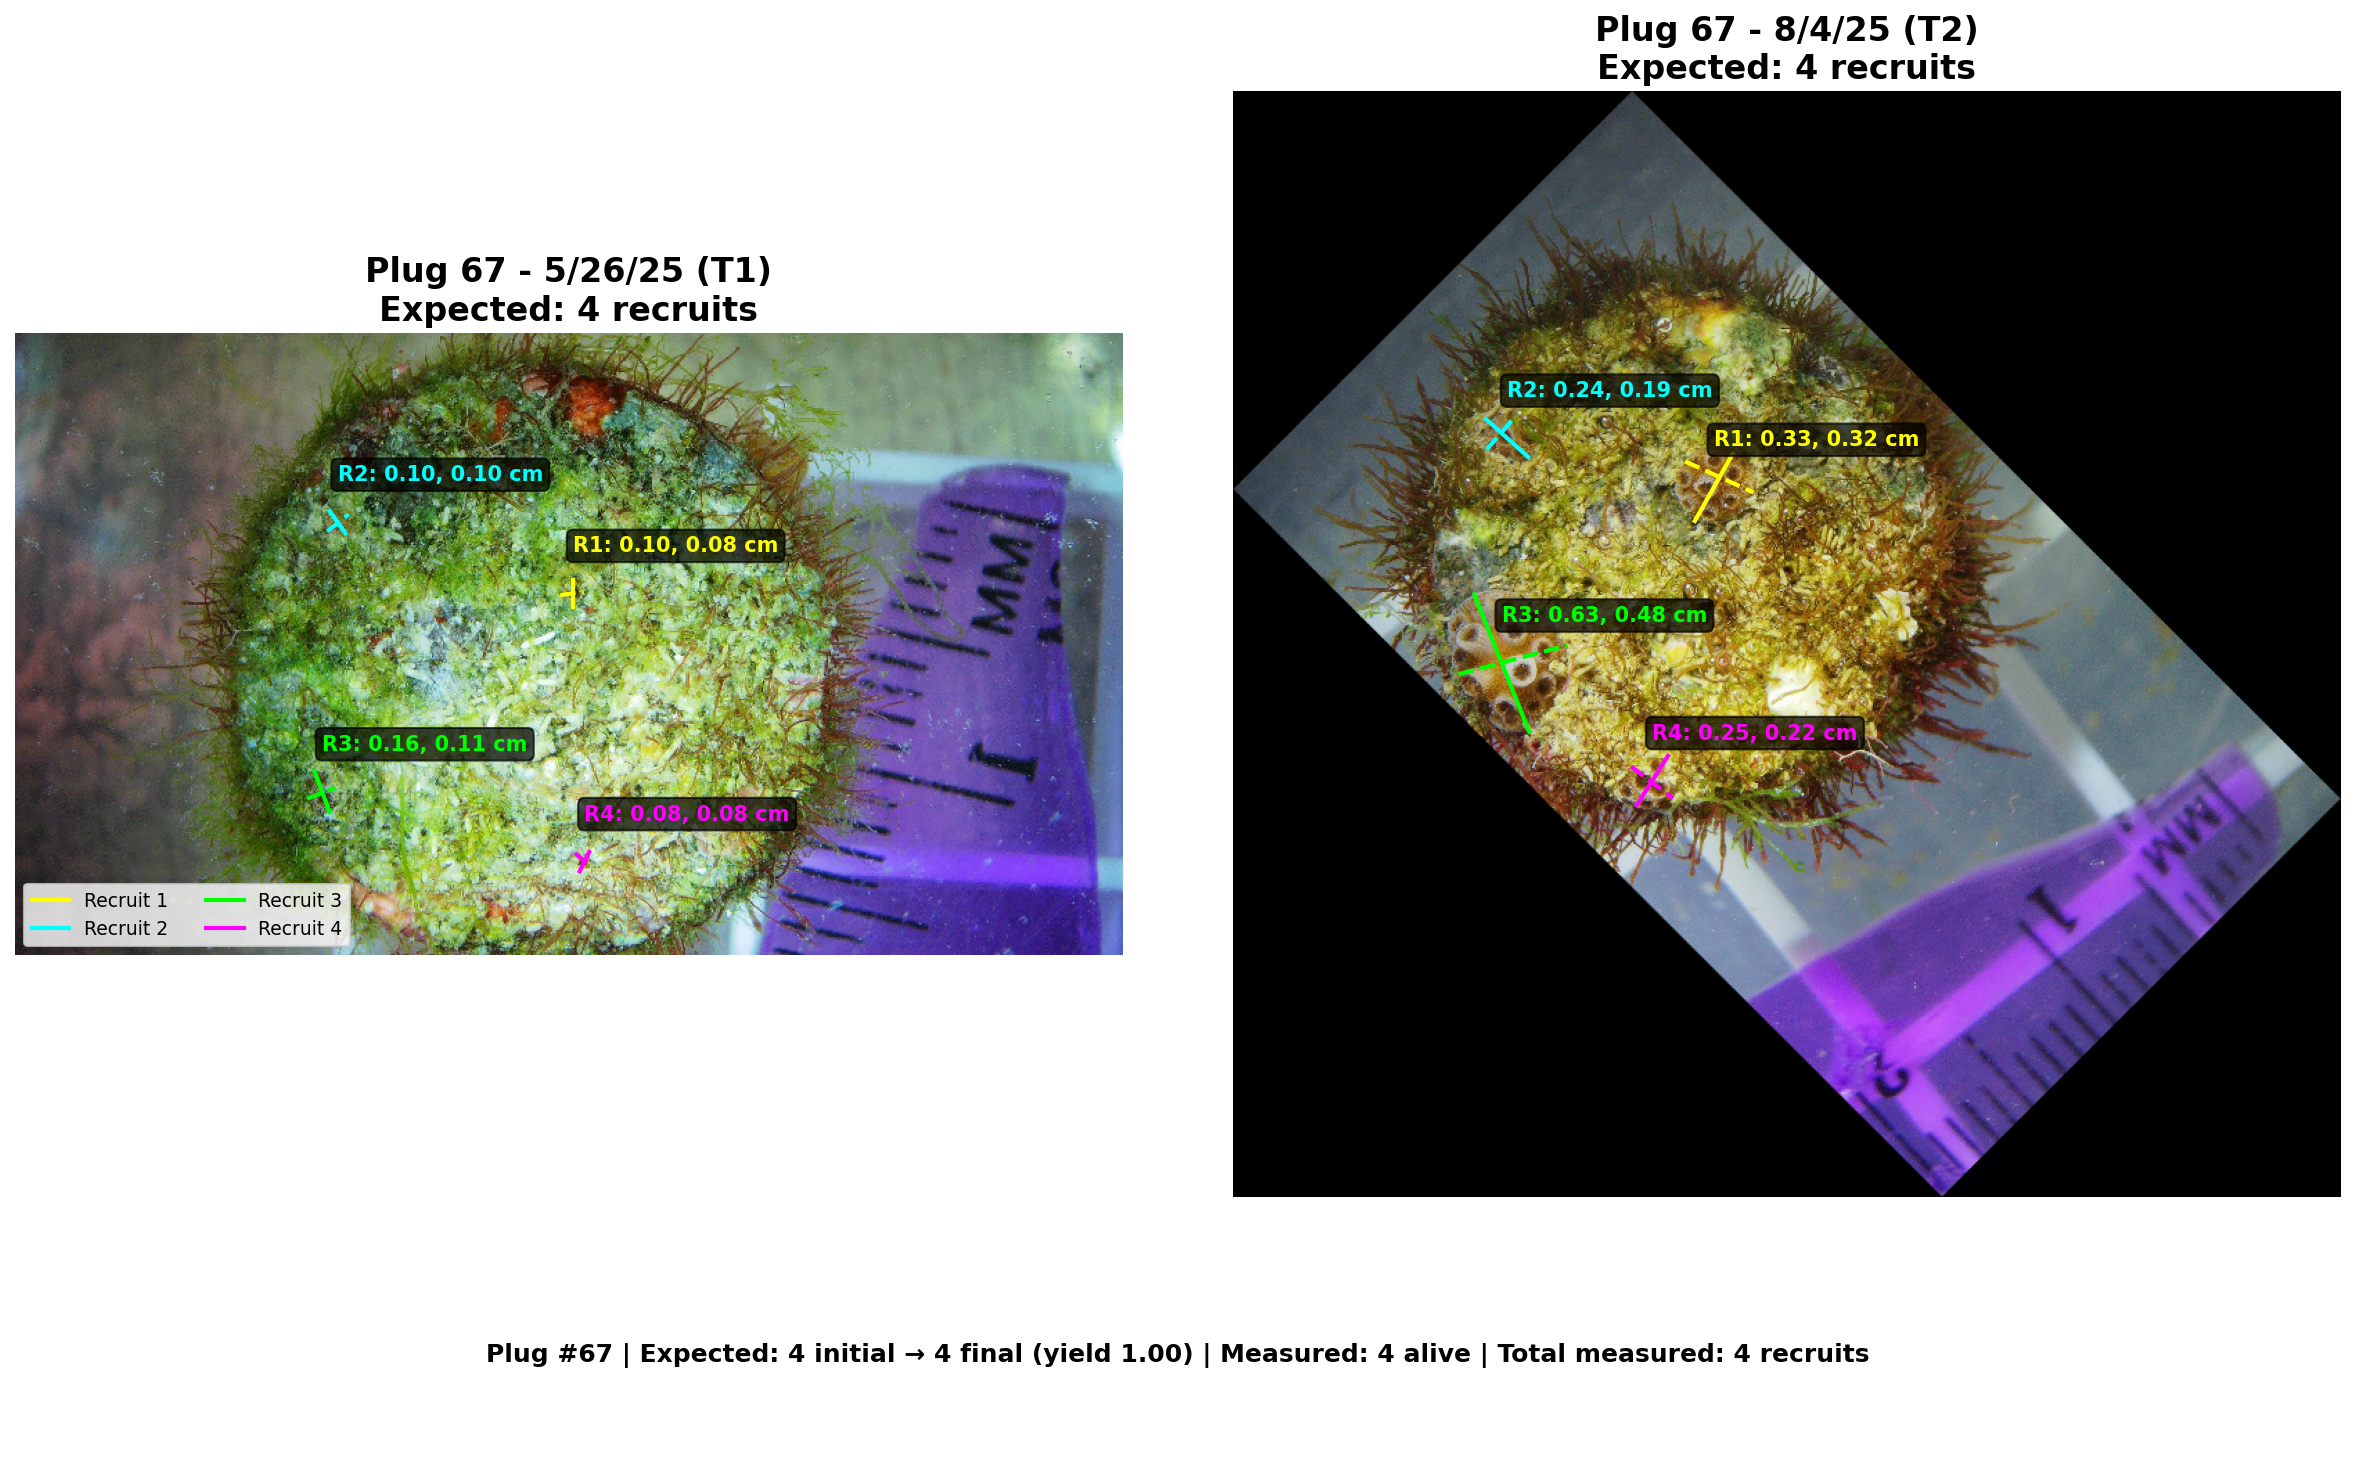
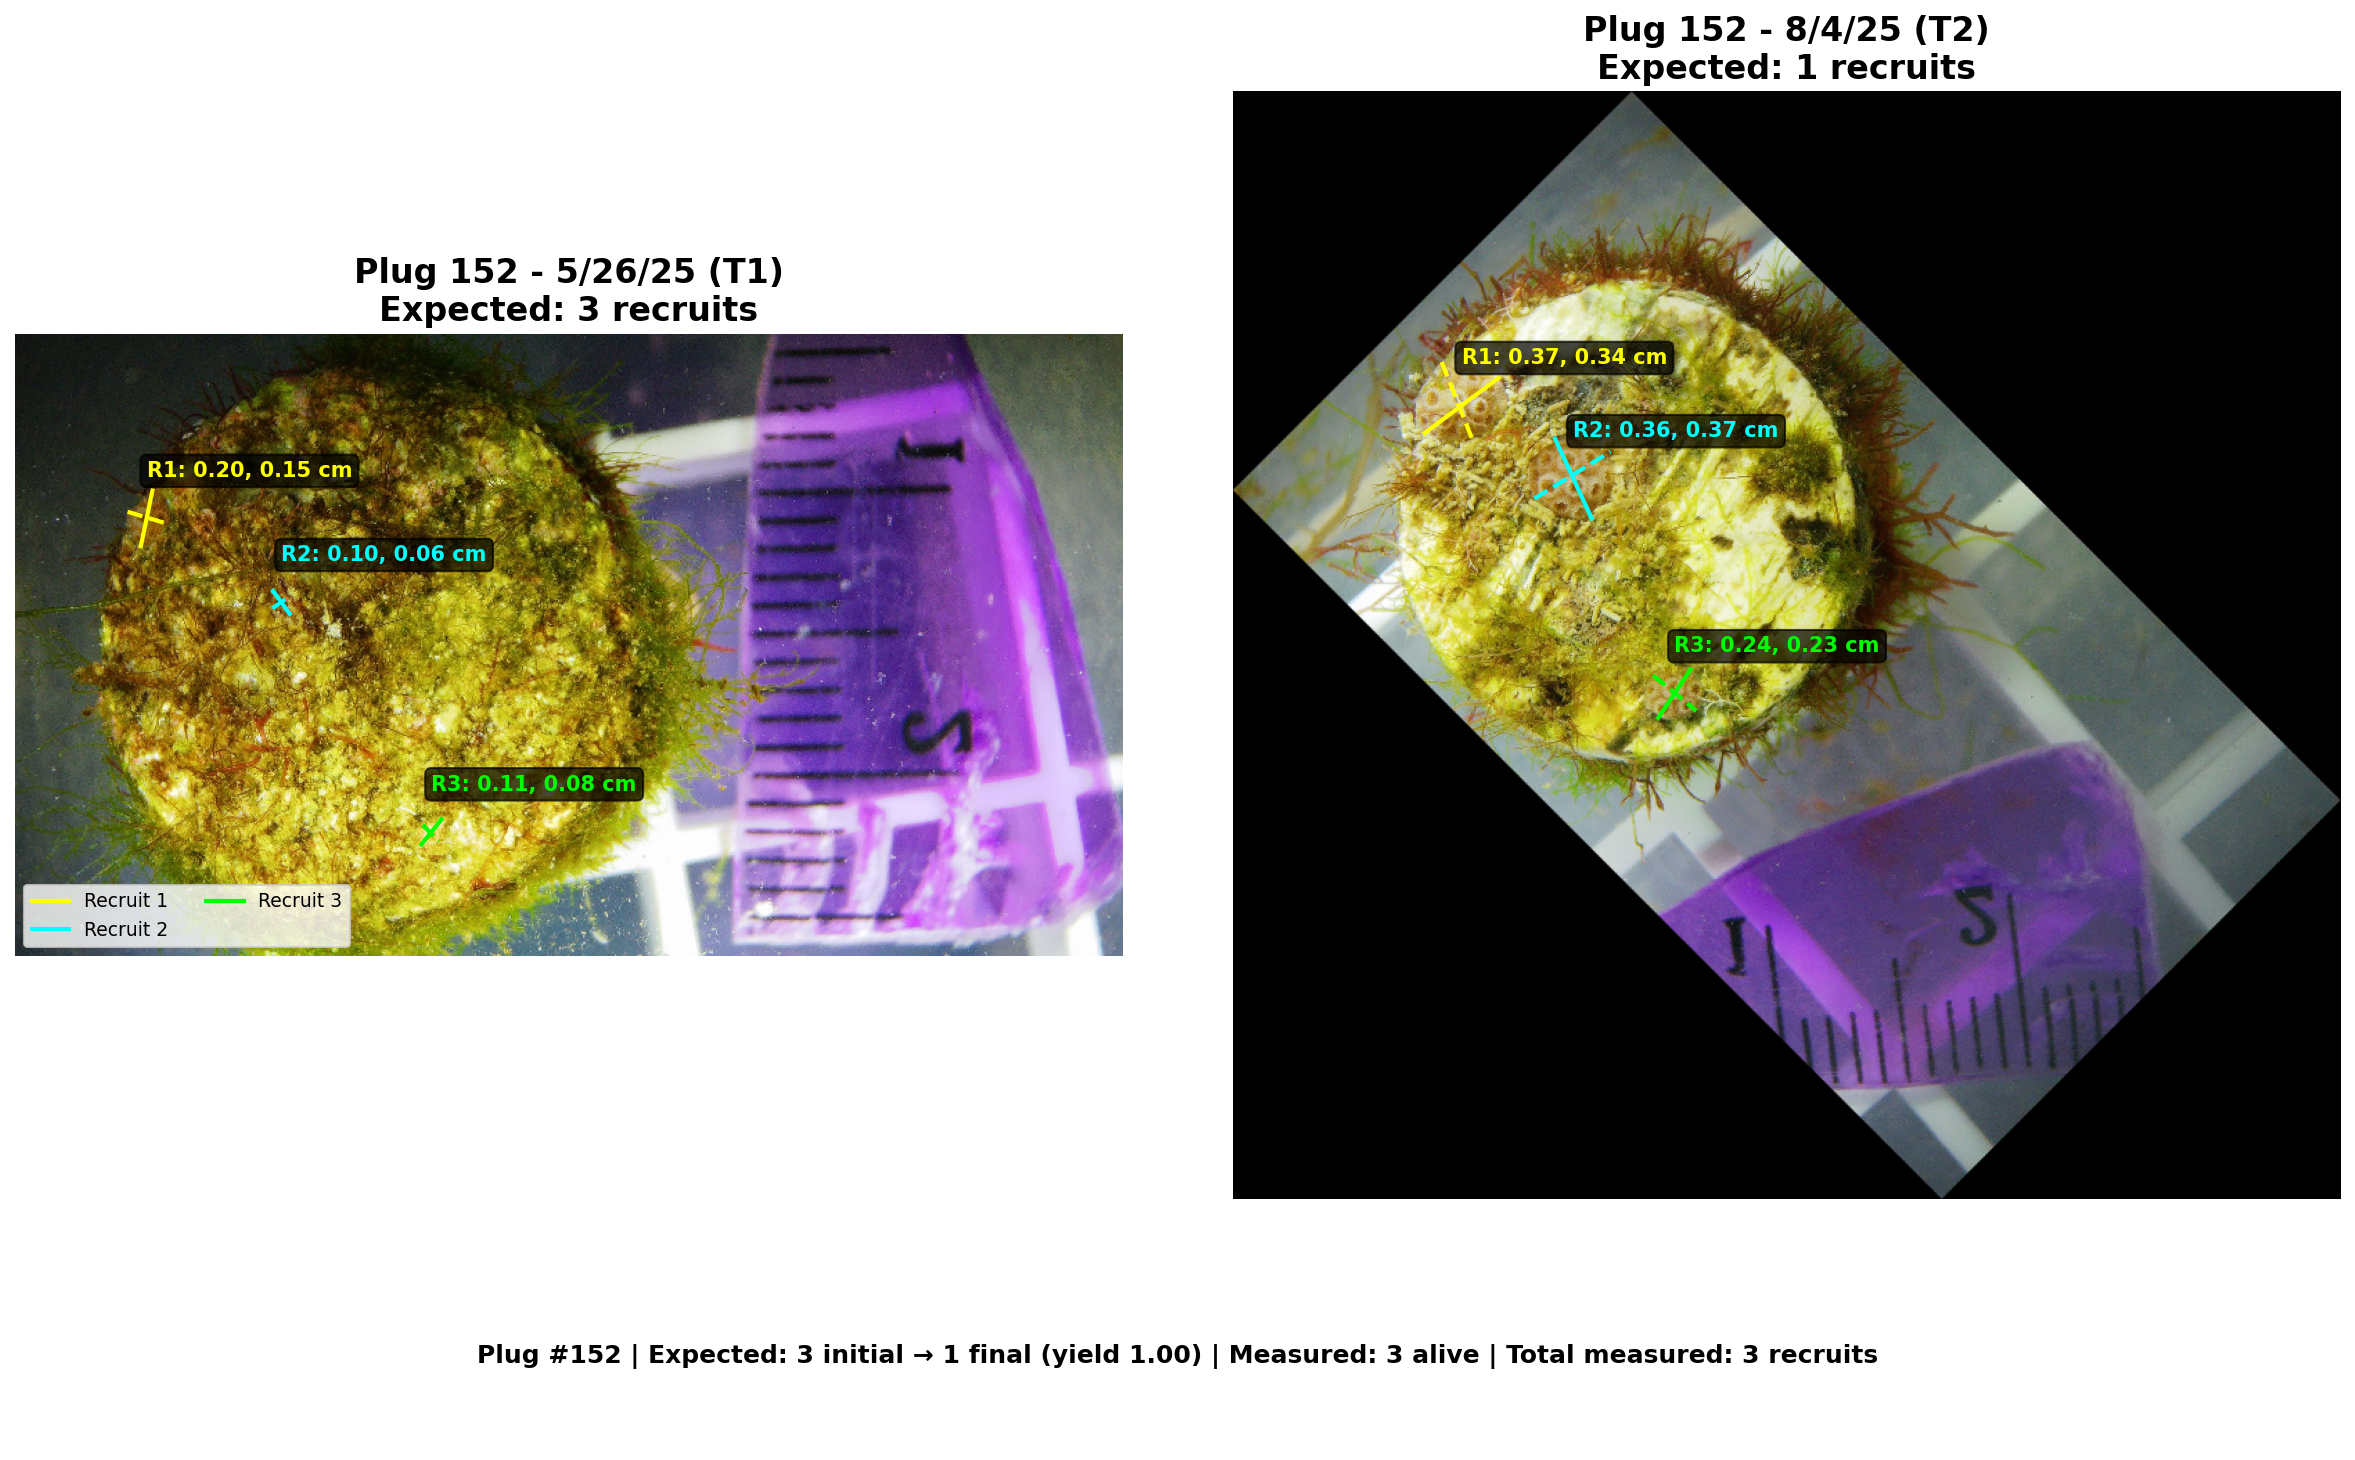
Each output shows the same plug at T1 and T2 with orthogonal diameter measurements color-coded per recruit. Summary statistics appear in the caption: expected recruits, measured alive, and yield.
Applications
Customize status labels for your field — no code changes needed.
Coral polyp recruitment tracking, growth rates across thermal stress experiments, mortality assessment on settlement plugs.
Bacterial colony growth curves, inhibition zone measurement in antibiotic assays, biofilm area quantification.
Cell culture confluence tracking, spheroid growth in 3D culture, organoid size measurement between passages.
Seedling growth monitoring, leaf spot disease progression, lichen colony expansion tracking in field studies.
Crystal growth quantification, corrosion zone progression, particle size distribution across treatment conditions.
Lesion size tracking across imaging sessions, wound healing area measurement, tumor spheroid assay analysis.
Quick start
Requires Python 3.8+. Works on Windows, macOS, and Linux.
Two directories — one per timepoint. Matching filenames across folders (e.g. sample_001.jpg in both).
Set input/output paths, optional metadata file, and customize button labels in config.yaml.
Launch with python polyp_pal.py config.yaml. Point-and-click your diameters. Close when done to export.
| Key | Action |
|---|---|
| qe | Rotate image 2 left / right |
| +- | Zoom in / out |
| ↑↓←→ | Pan the view |
| r | Reset view |
| u | Undo last action |
| h | Show help |
# Clone repository git clone https://github.com/NicolasCroft/PolypPal.git cd PolypPal # Install dependencies pip install -r requirements.txt
# Image directories dir1: "/path/to/timepoint1" dir2: "/path/to/timepoint2" # Output files output_excel: "/path/to/output.xlsx" annotated_dir: "/path/to/annotated" # Optional metadata metadata_excel: null # Customize status buttons button_labels: status_1: "Dead" status_2: "Chimera"
python polyp_pal.py config.yaml
Cite PolypPal
PolypPal was validated against ImageJ measurements on settlement plug images and used in a coral feeding study examining the effects of heterotrophic diet on Acropora tenuis and A. digitifera recruits. Please cite accordingly if used in your work.
Associated manuscript: Alessi et al. (under review). Effect of heterotrophic feeding on growth and bleaching response of Acropora tenuis and A. digitifera juveniles. Coral Reefs.